Data Story
Results
The results of the project include:
1 |GovHack Project Homepage| Description of the project
2 |Project Report| Details of the methods and results
3 |A Graph Abstract| General ideas presented by a graph
4 |Maps and New Datasets |Multi-source data integration
5 |System| Online interactive geovisualisation and decision-making system
6 |A list of recommendations| A list of future research and application ideas based on this project
The results are explained in the following sub-sections.
Spatial Variables
In this project, the ocean climate and environment are quantified using ocean surface temperature and salinity data, respectively.
To explain the potential variables that affect the ocean temperature and salinity, two categories of potential explanatory variables are collected from multiple sources, including Australian government open data, remote sensing data, and other open data. One category of explanatory variables is ocean flows information, including zonal (eastward) velocity component, meridional (northward) velocity component, and surface height on t-cells. Another category is about human activities, including shipping activity density, locations of ports, offshore oil and gas platforms and activities, and locations of populated cities.
To evaluate the impacts of ocean climate and environment on the marine ecosystems, the ocean biovolumes data is collected and visualised.
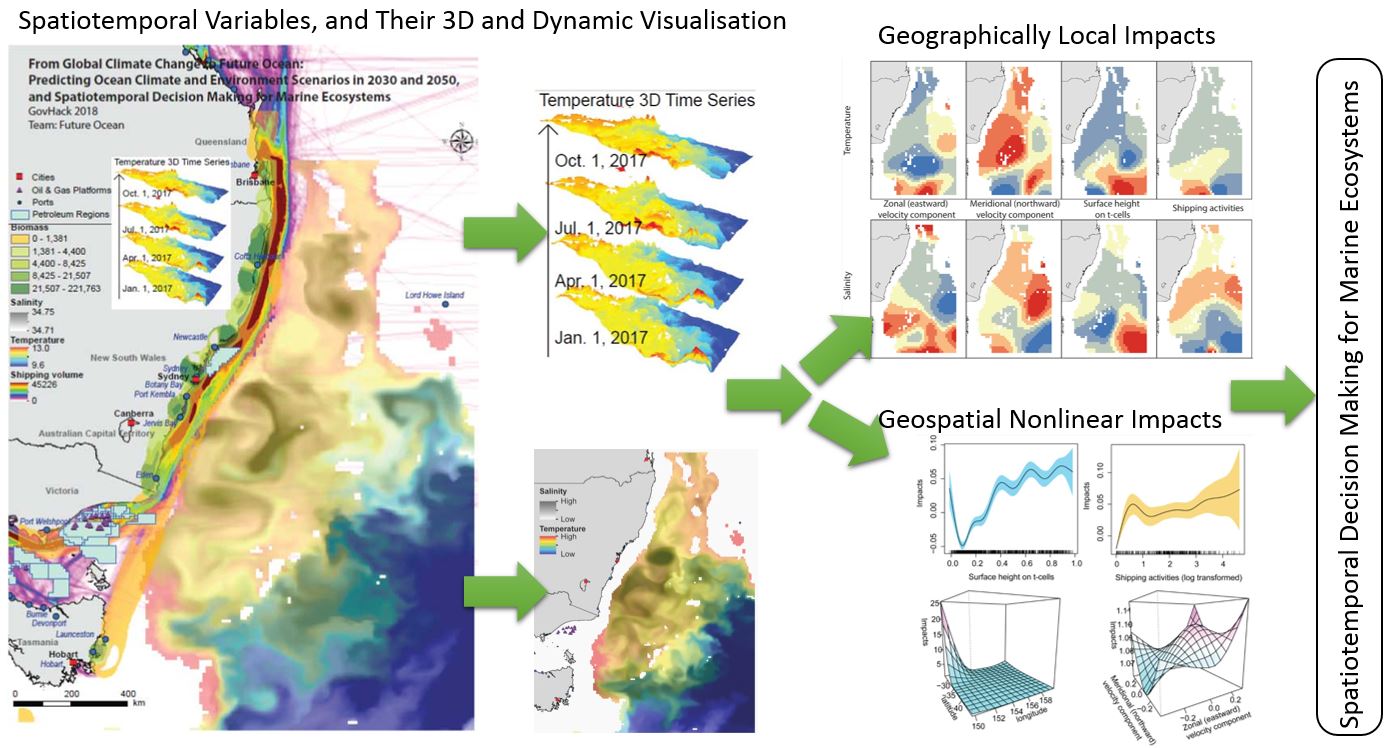
The above data sets and spatial variables are mapped in Figure 1. This map with high resolution and can be printed with A3 paper is uploaded on the website. Figure 2 presents the 3D time series of the ocean climate and environment variables with the example of temperature.
Figure 1. Map of the ocean climate and environment variables and the explanatory variables
Figure 2. The 3D time series of the ocean climate and environment variables (temperature here)
Spatiotemporal dynamic maps
The spatiotemporal dynamic maps of ocean climate and environment variables are generated as a video: Dynamic spatiotemporal maps.mp4.
Geographically local impacts analysis
Figure 3 shows the geographically local impacts of ocean flows and human activities variables on the ocean climate and environment that are explored using the geographically weighted regression (GWR) method. Results show the impacts of different variables have significantly varied impacts across space.
Figure 3. Geographically local impacts of ocean flows and human activities variables on the ocean climate and environment
Geospatial nonlinear impacts analysis
Geospatial nonlinear impacts of ocean flows and human activities variables on the ocean climate and environment are calculated using geospatial generalised additive models (GAM). The GAM model is performed using R. The results are shown in Figure 4. Results show that the explanatory variables have significant nonlinear impacts, and the impacts are varied with the locations and the velocity components in two different directions.
Figure 4. Geospatial nonlinear impacts of ocean flows and human activities variables on the ocean climate and environment
Geospatial decision making, significance and potential applications of the study
In terms of the above results, the geospatial decision making, significance and potential applications of the study include the following parts.
- Provide methodologies, data sets and quantitative evidence for researchers and marine industries’ more accurately and geospatially local exploration of oceans.
- Provide quantitative basis for the spatiotemporal decision making for the management of ocean environment and marine ecosystems.
- This project provides a benchmark for the collaboration of industries and academia for addressing a sophisticated problem about ocean environment and human activities.
The project brings ideas, knowledge, technologies and decision making from both industries and academia. In general, industries have rich practical experience and knowledge in certain fields and developed skills of technologies. Academic researchers are expert in proposing new concepts, theories and methods, and developing new tools.
In this project, the industries include government agencies and companies of ocean environment protection and management, marine ecosystems monitoring and management, ports management and shipping industries. Academic researchers can provide new methods for spatiotemporal data analysis and decision making, manage and update database, explain data-driven results with professional knowledge in ocean, environment, ecology and human activities.
- This project provides a benchmark for applying the methodologies and outcomes in the relevant studies in other regions in both Australia and the world.
Figure 5 shows the application of the methodology and data sets for the ocean in the western part of Australia.
The methodology and outcomes also can be applied in other parts of the world where ocean climate and environment are of important concerns, and human activities are dense, such as offshore oil and gas industries.
Figure 5. Application of the methodology and data sets for the ocean in the western part of Australia