Team Name:
No GovHack for Old Men
Team Members:

Feel the Burn!
Project Info
Team Name
No GovHack for Old Men
Team Members
2 members with unpublished profiles.
Project Description
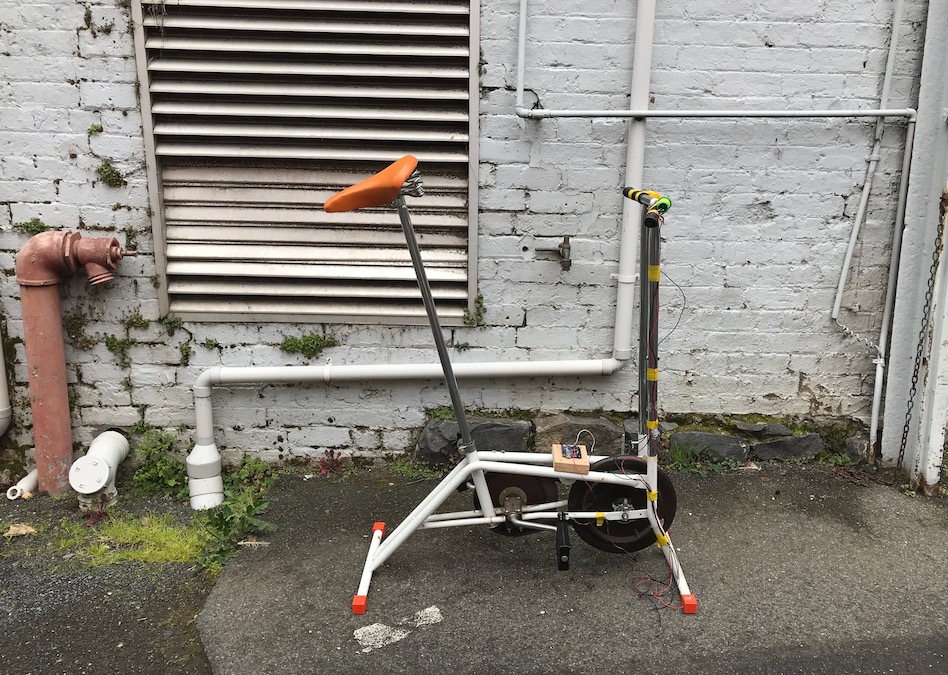
Feel The Burn is a cycling game that uses an exercise bike to enable the user to ride courses that have been generated from open data sets.
The original inspiration for the idea came from reflecting on what it means to really understand data. A key question we asked ourselves was: what if you were able to feel a data set by traversing it as though it were a landscape? Would you understand the data better? Would the experience be more memorable than other ways of exploring data?
From there, we developed the idea for “Feel The Burn”. In this game, the player is able to ride along virtual tracks that have been generated using a range of different datasets. As the player rides up a hill, resistance is applied to the exercise bike so that the player can “feel the burn” as they push against the resistance. Where the data descends, the resistance is released that the player is able to coast downhill and build up considerable speed. As the player rides each course, billboards beside the road call out points of interest and help contextualise the data the track has been generated from.
Feel The Burn was developed in Unity and incorporates an Arduino Leonardo which we use to sense wheel rotations on the exercise bike and also to control a servo which applies resistance to the bike when the player is riding uphill (and releases it when they’re coming down again). Our terrain is generated within Unity using real datasets (ranging from climate and environmental data, through to tourism statistics and water levels in hydro dams).
Data Story
A number of the datasets we chose were related to climate change and include strong linear trends. We took our title from the experience of riding up the slopes created by data relating to atmospheric carbon and annual temperature anomalies (both examples of data that has been steadily increasing over long term trends). However, we also included some other kinds of experiences in our game. Riding the terrain we’ve generated from the decreasing landmass in Greenland is the opposite experience, with the player riding downhill almost the entire way.
Once we’d prototyped a few experiences that related to climate data, we decided to throw in a few bonus levels where we fed different data sets into Feel the Burn to see if we could create some interesting riding experiences. One data set that worked well was tourism visitation data. We grabbed historic information about the number of visitors to Australia from China and used that to generate a new track in the game. This track is particularly interesting, as it combines a long term upward trend with the seasonal effect of tourism booms in January and February each year. Our final experiment was to take water level information from a particular Hydro dam in Tasmania and create a track based on the rise and fall of the water level over time. The particular dam we chose, Lake MacKenzie has completely filled and completely emptied a number of times during our period of interest, creating a track with many hills and valleys for the player to ride.
We sourced our Australian climate data from the Australian Bureau of Meteorology and our international climate data from NASA.
We sourced our tourism visitation numbers from Tourism Australia.
We sourced our hydro energy storage information from Hydro Tasmania.
Background music in the game and video is "Summer" from bensound.com
Team DataSets
NASA's Vital Signs of the Planet
Description of Use We used this data to generate a number of tracks for Feel the Burn that are based on global climate data. Datasets we used included rising CO2 levels over time and vanishing ice sheets in Greenland.
Energy in Storage (Hydro Tasmania)
Description of Use We used this data set to generate a track for our cycling game based on the water levels in Lake MacKenzie. This lake cycled between empty and full a number of times during our period of interest, leading to an interesting track with plenty of peaks and valleys.
Tourism Australia International Visitor Arrivals
Description of Use We used data on Chinese tourism in Australia to create a course for Feel the Burn. This track had a gradual upward incline because of a long-term trend of increasing Chinese tourism in Australia, as well as regular hills created by tourism boom months in January and February each year.
BOM Climate Change Variability
Description of Use Used a range of data sets to generate smoothed tracks in Unity for riding on our exercise bike. Smoothing was done using a pretty basic trendline approach.
Challenge Entries
There are no challenge entries to display for this team as yet.